During everyday conversations at work, you might hear things like “This sponsorship will cost us a fair amount of money” or “We anticipate a slight increase in revenue” or even, “This investment should deliver a decent return.” But what do these phrases really mean? How do you make business decisions based on phrases like “a fair amount, slight increase or decent return?”
This is the crux of the issue when it comes to helping your leadership team make decisions about growing the business. Risk management is the process that helps organizations identify, assess, and reduce the impact of potential threats or uncertainties. It’s a way to be proactive about preparing for the unexpected and protecting an organization from potential losses.
Risk Management Is An Imperfect Process
Risk management is an imperfect process, however. Organizations operate in fast-changing environments and not all risks can be foreseen. On the other hand, operating with some risk is to be expected and is acceptable. Therefore, leadership teams need to make decision not knowing exactly what tomorrow will bring.
This is where risk management plays a critical role. Despite this uncertainty, you can assess your organization’s current risk and use your experience and judgment to present a mitigation plan that will justify the actions and investments needed to help reduce risk to more acceptable levels. The drawback of this approach is that it is often very qualitative.

The Ubiquitous Heat Map
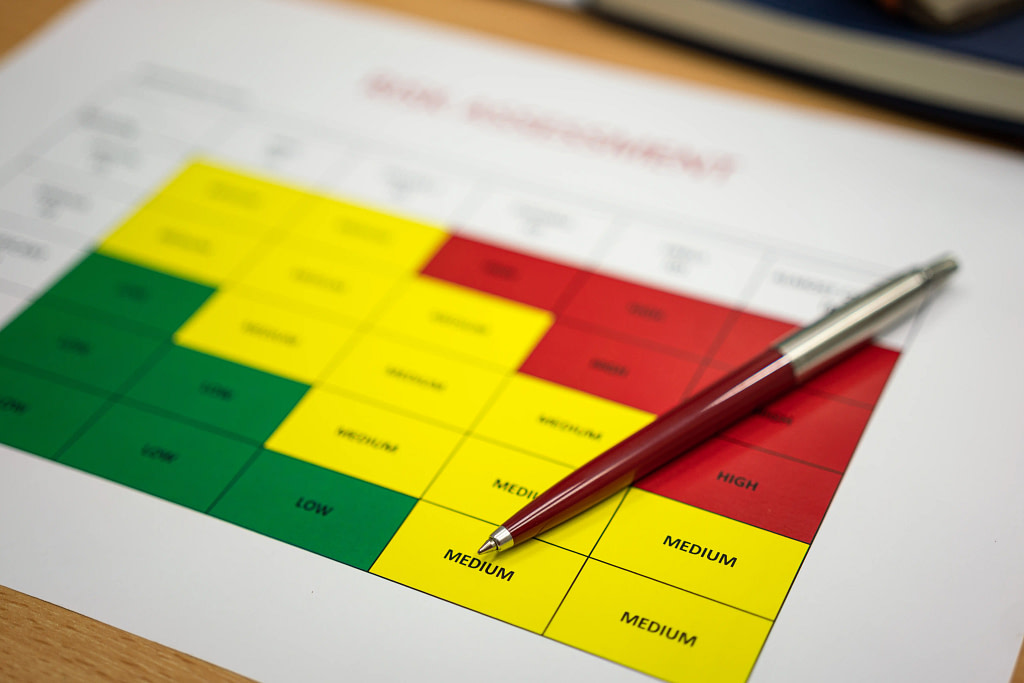
The risk heat map is a ubiquitous tool in risk management. A risk heat map is a visual chart used to represent risks based on their likelihood and impact, typically displayed using a color-coded matrix. The vertical axis usually represents the severity of the impact (low to high), and the horizontal axis indicates the likelihood of the risk occurring (rare to frequent). Risks are categorized into different zones (green for low risk, yellow for medium, and red for high), allowing organizations to quickly identify and prioritize risks that need immediate attention.
There are many reasons why heat maps have been used for so long. Heat maps are visual and provide a clear and easy-to-read overview, they categorize risk based on urgency (high, medium and low) and they provide a simple, at-a-glance overview of an organization’s risk landscape that is easy for business leaders and executives to understand.
Unfortunately, heat maps aren’t the panacea hoped for. Heat maps are primarily qualitative tools used and understood by risk professionals. The assessment that the map represents depends heavily on the judgment of the risk assessors, which can lead to inconsistencies. In addition, risks are represented in discrete categories (e.g., low, medium, high) which may not be uniformly defined and accepted across different groups and departments, and may oversimplify and not reflect the nuanced nature of risks. All this said, the biggest drawback of heat maps is that there is nothing quantifiable about them.

Color-Coded Heat Maps Can’t Answer the Hard Questions
Often, GRC professionals say that their Leadership team only cares about growth. They struggle to connect the important daily work they do with the C-Suite’s lofty growth goals. In large part, this is because they speak different languages. Leaders make decisions based on dollars and cents, it’s the language they know and understand. Therefore, qualitative risk assessment methods often fall short.
If the CISO (Chief Information Security Officer) uses a heat map to explain risks across the organization, they can only tell part of the story. They use the heat map to clearly show where risk levels are too high and the areas that should be prioritized. They are a great starting point in conveying the risk landscape of the business.
However, the follow up questions leadership teams often ask are typically something along the lines of, “How much money is at stake if we get breached” and “How much is it going to cost to reduce our risk?” This is where qualitative risk assessment methods often fall short. For these questions, an answer of “yellow” (or any other color for that matter) is wholly unacceptable.
To answer all these follow-up questions and provide a complete picture of risk, you need a better way to assess, measure, and communicate the risk you have. Risk quantification measures risk and risk mitigation options in monetary terms. Because dollars and cents are tangible and understood by all, risk quantification can help you communicate consistently, improve decision-making, and help shift how your company sees risk from an obstacle to a strategic advantage.
Quantifying risks helps you figure out which ones to tackle first to get the most benefit. It gives you a clear way to assess different risk-reduction strategies, showing how much each option lowers your risk and helps you compare their value. It also makes it easier to explain which risks need attention and shows how your recommendations support business goals, proving that you’re managing risks in a smart, strategic way. And, it doesn’t need to be overly complicated.
Getting Started With Risk Quantification
Cyber Risk Quantification (CRQ) is described as “any risk assessment approach that measures an organization’s risk exposure and expresses it in financial or business-relevant terms.” CRQ can be as simple as a scale that ranks the likelihood and potential cost impact of specific risks. There are also specialized vendors that provide CRQ solutions that can support very complex scenarios and provide AI-enabled statistical modeling and ongoing risk analysis.
At Compyl, when it comes to cyber risk quantification, we believe that any starting point is better than relying on qualitative measures alone. A common starting point for many organizations is to determine their risk tolerance levels. Risk tolerance refers to the amount and type of risk that an organization or individual is willing to accept in pursuit of its objectives. It defines the boundaries or limits of acceptable risk and helps guide decision-making regarding risk management and mitigation. Risk tolerance can vary based on factors such as industry, company size, and regulatory requirements. It also involves understanding an organization’s goals and aligning the acceptable level of risk with those objectives.
From here, companies can use a standard likelihood and impact analysis and combine it with a financial level of impact. So, if a company was using a typical 5X5 matrix (heat map), each value from 1 to 25 can be associated with a specific financial impact. This allows both inherent risk and residual risk costs to be calculated.
Then, the risk tolerance can be layered over that to determine whether the current level of residual risk is above the comfort level for that department, group or the organization depending on what the heat map represents.
For example, if an organization’s residual risk score, which is based on their likelihood X impact score for a ransomware attack that makes the company’s network and data inaccessible, is a 24 but their tolerance is really a 12, the financial benefit of mitigating that risk is more tangible. An Information Security Leader can then justify the investments needed to bring the residual risk down to an acceptable level based on a cost-benefit analysis. This process allows multiple mitigation options to be considered and makes the decision clear and straightforward.
Beyond this simple process, many organizations want to factor in the level of complexity, level effort or other company specific attributes to calculate risk in financial terms. The Compyl platform can support these company-specific nuances.
Larger organizations may choose to run Monte Carlo simulations to model uncertainties by running a large number of simulations to predict risk outcomes or use the Expected Monetary Value Method that helps calculate risk based on potential outcomes and their probabilities.
Still others may adopt The FAIR™ quantitative risk analysis model that uses risk scenarios, Loss Event Frequency (LEF) and Loss Magnitude (LM) and then breaks these down further to enable more detailed and accurate risk assessments. Others use Monte Carlo simulations Monte Carlo simulation can be used to model uncertainties by running a large number of simulations to predict risk outcomes.
When it comes to connecting risk to its impact on business decisions, qualitative risk assessments have long proven valuable. However, as Leadership Teams are increasingly being held accountable for protecting their company and its assets including information assets, cyber risk quantification enhances qualitative measures to help provide a clearer picture of risk and the expected positive outcomes resulting from different levels of investment in mitigation strategies.
Connect Risk to Strategic Objectives with Cyber Risk Mitigation
If you’re looking to uplevel your ability to convey risk in monetary terms that your leadership team will understand, contact us today. We’ll talk to you about your goals and discuss ways we can help you present a more complete picture of risk based on your GRC maturity and your goals.


