FAIR (Factor Analysis of Information Risk) is an open standard for quantifying cyber and operational risk in financial terms. Instead of rating a risk “high,” “medium,” or “low,” FAIR estimates how often a loss event is likely to occur and how much it would cost, producing a dollar figure a board can act on.
Every GRC team can rank a risk red, amber, or green. Almost none can answer the question the board actually asks: what does this cost us? This guide explains how FAIR closes that gap, and why heat maps keep failing where it matters most.
Why do risk heat maps fail at the board level?
Heat maps fail because a color is not a decision input. “High” cannot be compared against a budget line, weighed against an insurance premium, or ranked against another “high.” Qualitative risk matrices compress very different risks into the same cell and invite inconsistent scoring between assessors.
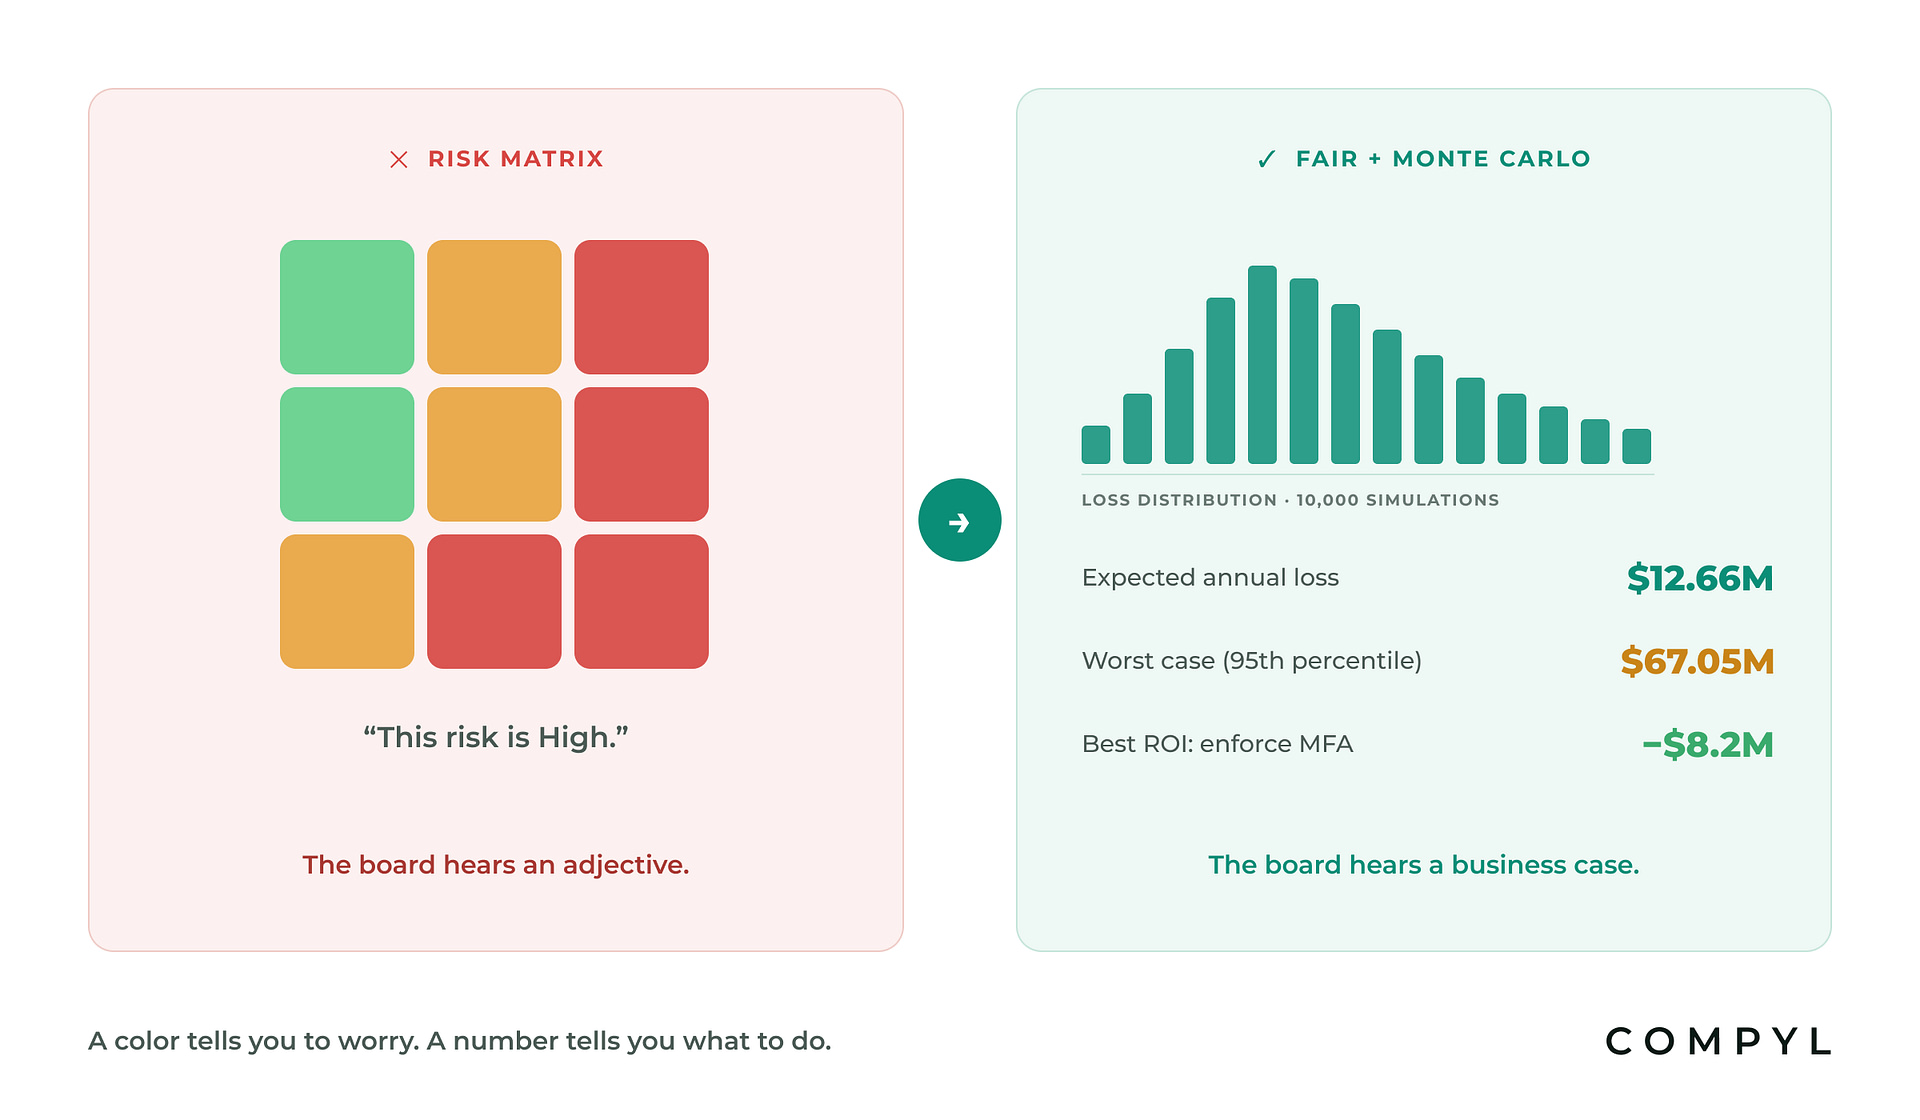
The stakes of getting that translation wrong are measurable. According to IBM’s Cost of a Data Breach Report 2025, the average breach now costs $4.44 million. When a CISO tells the board a risk is “red,” the board hears an adjective. When a CISO says “this risk carries an expected annual loss of $2.1M, and a $150K control reduces it by $1.4M,” the board hears a business case.
A color tells you to worry. A number tells you what to do.
How does the FAIR model work?
FAIR, maintained as an open standard by The Open Group and advanced by the FAIR Institute, decomposes risk into two factors you can estimate from evidence:
- Loss Event Frequency (LEF) — how many times per year a loss event is likely to occur, derived from threat event frequency and the strength of your controls.
- Loss Magnitude (LM) — how much a single event would cost, combining primary losses (response, replacement, downtime) and secondary losses (fines, legal fees, customer churn, reputation).
Because both inputs are uncertain, FAIR doesn’t produce a single guess. A Monte Carlo simulation runs the model thousands of times across the plausible ranges, producing a loss distribution: the expected annual loss, the worst case at a chosen confidence level (for example, the 95th percentile), and the probability of exceeding any threshold that matters to your business.
A worked example
Ask a FAIR-based platform, “If our customer database were breached, what would it actually cost us?” and the output looks like this (illustrative figures):
- Expected annual loss: $12.66M
- Worst case (95th percentile): $67.05M
- Highest-ROI mitigation: enforcing MFA, reducing expected loss by $8.2M
The same risk a heat map calls “High,” now in numbers your board, CFO, and auditors can act on.
Heat maps vs. FAIR: a side-by-side comparison
| Risk heat map | FAIR quantification | |
|---|---|---|
| Output | Color / ordinal score | Dollar-based loss distribution |
| Board conversation | “This one is red” | “Expected annual loss is $12.66M” |
| Prioritization | Subjective ranking within colors | Rank by financial exposure |
| Control decisions | Intuition | ROI per mitigation, in dollars |
| Comparability | Can’t compare two “highs” | Directly comparable across risks |
| Defensibility | Assessor judgment | Reproducible model with stated inputs |
| Insurance alignment | None | Maps to limits and deductibles |
What stops teams from adopting FAIR?
The honest answer: doing FAIR by hand is work. Traditional adoption stalls on three problems. Data gathering is manual, so analysts spend weeks assembling loss data and control evidence per scenario. Modeling expertise is scarce, since few teams have a quantitative analyst. And results go stale, because a quantification done in January describes January.
This is where automation changes the economics. If your GRC platform already holds your controls, incidents, vendors, and evidence as live, structured data, the inputs FAIR needs already exist, and they stay current.
How Compyl automates FAIR risk quantification
Compyl builds FAIR and Monte Carlo simulation directly into its risk register, introduced in the Compyl 26.2 release:
- Ask in plain language. Describe the risk the way you’d explain it to a colleague; Compyl runs the FAIR model and answers in dollars.
- Grounded in your live data. Loss-event frequency and control strength draw on your actual control health, evidence, and incident history from 125+ in-house integrations, not generic industry tables.
- Monte Carlo, 10,000 simulations. Every quantified risk shows its loss distribution, expected annual loss, and worst-case percentile.
- ROI on every mitigation. Compare controls by dollars of risk reduced, so budget conversations start from business impact.
- Humans approve. AI prepares the analysis; your team reviews and owns every number that reaches the board.
Frequently asked questions
What does FAIR stand for in risk management?
FAIR stands for Factor Analysis of Information Risk. It is an open, international standard for quantifying information and operational risk in financial terms, maintained by The Open Group and advanced by the FAIR Institute.
Is FAIR better than a risk matrix?
For decision-making, yes. A risk matrix communicates relative concern; FAIR produces dollar figures that can be compared against budgets, insurance, and other risks. Many teams keep a matrix for quick triage and use FAIR for the risks that drive spending decisions.
Do you need a data scientist to use FAIR?
Not with modern tooling. Platforms like Compyl automate the modeling and Monte Carlo simulation, and ground inputs in live GRC data. Teams review assumptions and approve outputs rather than building models by hand.
What data does FAIR quantification need?
Estimates or evidence for how often a loss event could occur (threat activity, control strength) and what one event would cost (response, downtime, fines, churn). The more of this that comes from live systems rather than guesses, the more defensible the output.
How often should risks be re-quantified?
Whenever the inputs change: a control degrades, a new integration surfaces exposure, or the threat landscape shifts. Because Compyl’s inputs are live, quantifications update continuously rather than annually.
See your top risk in dollars, on your own data. Request a demo →